
Image
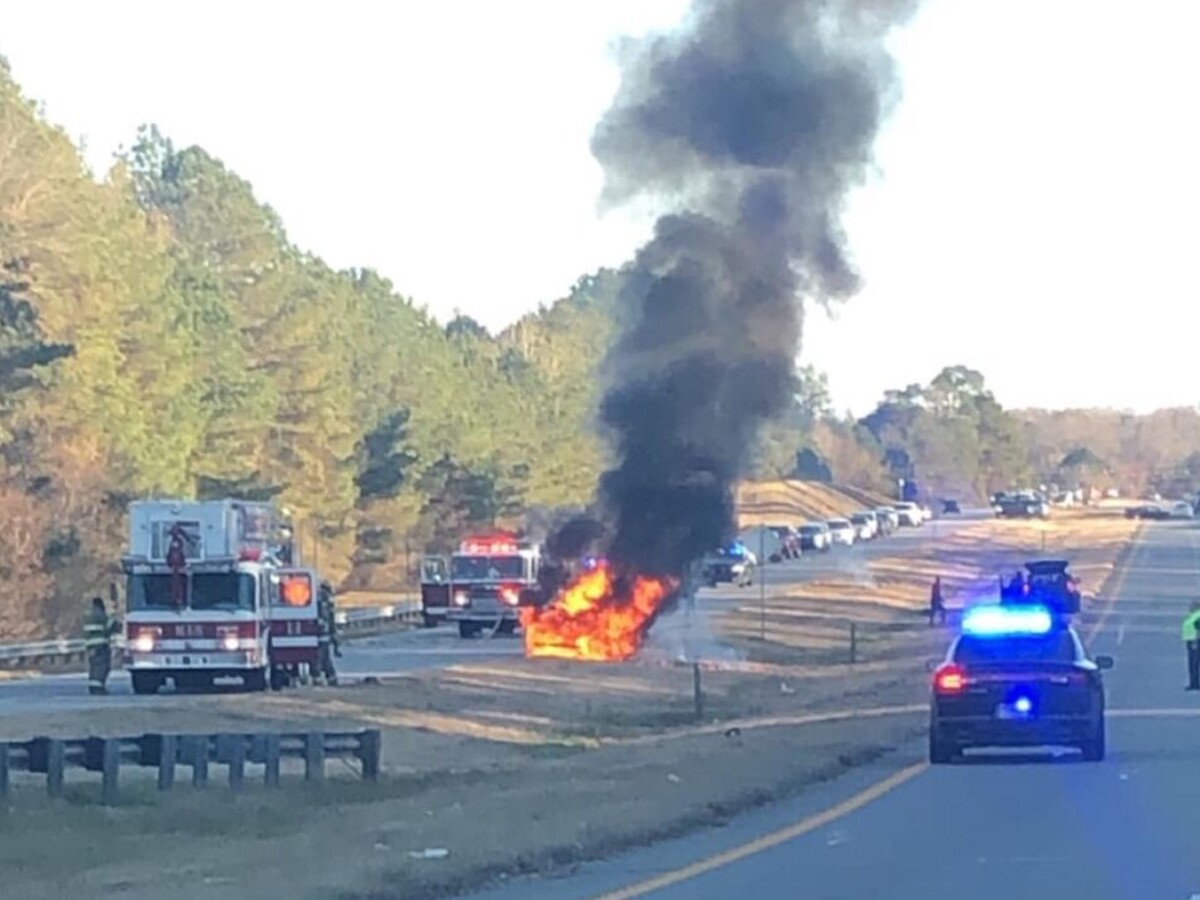
Photo posted on Milledgeville Roadblock Warnings Facebook page Dec. 23, 2021
"Milledgeville has the worst drivers."
"People in Milledgeville can't drive."
These are a few of the regular comments on the supersized Milledgeville Roadblock Warnings Facebook page, easily the largest and most active Facebook page in town. The page is approaching 20,000 followers and has an army of free labor and volunteer contributors, ready to stop what they're doing and post a pic and description of a traffic accident around town.
If you're familiar with the Milledgeville Roadblock page, it's easy to understand why so many people would think that "Milledgeville has the worst drivers" and "people in Milledgeville can't drive." Is that actually true, though? In most other communities, for example, there aren't three different angles of every random fender bender on Facebook. There are some other aspects of human nature in play, as well. Many people in small-town America think that "we have the worst drivers" and "we have the worst hospital" and "we have the most unpredictable weather," regardless of how true any of that is.
There's no definitive or "provable" way to determine if Milledgeville has bad drivers. There are way too many variables and not enough readily available data. The Governor's Office of Highway Safety's website offers a very general snapshot, however. The website offers county-by-county data for "Crashes & Injuries" between 2013 to 2018, as well as "All Traffic Fatalities" between 2014–2019.
For Part 1 of this series, we will use every Georgia county that has at least some part of US 441 running through it, beginning with Rabun and ending with Clinch. For "Crashes & Injuries," the median/middle year of crashes between 2014 to 2018 will be used. In Baldwin County, for example, there were 1,767 documented "Crashes & Injuries" in 2014, 1,915 in 2015, 2,032 in 2016, 1,957 in 2017 and 1,200 in 2018, so therefore 2015 will be used as the median/middle year (1,915 Crashes & Injuries).
In terms of traffic fatalities, the average number of fatalities will be used between the years 2014 to 2019. For population, meanwhile, the latest 2020 Census figures will be used.
•••If you're using mobile view, hold your phone sideways for best viewing. If you clicked on the article directly from Facebook, you may or may not be able to view it properly, depending on the browser. If the table doesn't appear properly, log on to baldwin2k.com and then click on the article for sideways viewing.
| Rabun (16,833) | 1 fatality for every 3,485 residents (5th worst) | 1 accident for every 40.9 residents (7th worst) |
| Habersham (46,031) | 1 fatality for every 5,876 residents (14th worst) | 1 accident for every 36.6 residents (4th worst) |
| Banks (18,035) | 1 fatality for every 2,613 residents (2nd worst) | 1 accident for every 41.7 residents (9th worst) |
| Jackson (75,907) | 1 fatality for every 4,518 residents (10th worst) | 1 accident for every 37.5 residents (6th worst) |
| Clarke (128,671) | 1 fatality for every 9,602 residents (best) | 1 accident for every 23.3 residents (2nd worst) |
| Oconee (41,799) | 1 fatality for every 7,600 residents (15th worst) | 1 accident for every 41.3 residents (8th worst) |
| Morgan (20,097) | 1 fatality for every 2,871 residents (3rd worst) | 1 accident for every 44.5 residents (11th worst) |
| Putnam (22,047) | 1 fatality for every 3,575 residents (7th worst) | 1 accident for every 44.5 residents (11th worst) |
| Baldwin (43,799) | 1 fatality for every 5,258 residents (12th worst) | 1 accident for every 22.9 residents (worst) |
| Wilkinson (8,887) | 1 fatality for every 1,975 residents (worst) | (data incomplete) |
| Laurens (49,570) | 1 fatality for every 4,797 residents (11th worst) | 1 accident for every 32.3 residents (3rd worst) |
| Wheeler (7,471) | 1 fatality for every 4,075 residents (9th worst) | 1 accident for every 92.2 residents (14th worst) |
| Telfair (12,477) | 1 fatality for every 3,403 residents (4th worst) | 1 accident for every 84.9 residents (13th worst) |
| Coffee (43,092) | 1 fatality for every 5,747 residents (13th worst) | 1 accident for every 44.2 residents (10th worst) |
| Atkinson (8,226) | 1 fatality for every 3,526 residents (6th worst) | 1 accident for every 95.6 residents (best) |
| Clinch (6,749) | 1 fatality for every 3,681 residents (8th worst) | 1 accident for every 37.1 residents (5th worst) |
As mentioned before, there are limitations with the data. Obviously, everyone who's died in a traffic fatality in a certain county wasn't necessarily a resident of that county. But, that's true across the board. Residents of Baldwin County occasionally lose their lives in traffic accidents in other counties, and vice versa. Also, some of the counties above are "interstate counties," and interstates inevitably bring more out-of-town traffic.
Nevertheless, the fact that Baldwin County has the most "Crashes & Injuries" per capita of all 16 counties recorded perhaps offers some insight. Actually, the two counties on the list with the most crashes per capita are the two "college counties" – Baldwin and Clarke. For Part 2 of this series, we will identify "college counties" in Georgia and measure crashes and fatalities.

***CLICK HERE to see our latest listings!!!


Very informative article.
I was diagnosed in March 2017, but was running around from doctor to doctor before I finally got a result that I was free from MND ALS. Mine started on top and progressed into the bottom. I could walk very little but need assistance as I have no balance.
I was diagnosed in March 2017, but was running around from doctor to doctor before I finally got a result that I was free from MND ALS. Mine started on top and progressed into the bottom. I could walk very little but need assistance as I have no balance.

Sunny, with a high of 89 and low of 62 degrees. Sunny for the morning, clear overnight.


Everything sounded so lovely until the end.
“We tried”
If that’s not disheartening idk what is. I feel the need to quote my mom here. “I can’t have nothin nice”. Wiser words were never said.
Oh! And for gods sake STAY HYDRATED if you want to save on hospital bills. I hate summer.
Member when the river was fun and didn’t get angry and take lives? You could float down hopefully by sunset with only burnt skin that was a problem for later you? Member when your biggest fear were all the scary gar lingering about?


loving that suit! That hippie has style and wears it well.